Multi-modal mobility hubs are a hot topic in urban planning. One of their core functions is to enable a seamless connection between the bicycle for first-mile and last-mile travel, and trains and buses for longer distance travel. This makes it essential that they are well accessible by bicycle. For a small applied research project, we were asked to assess the bicycle accessibility of different potential mobility hub locations in the Salzburg province.
Far too often, such an assessment is done by simply computing bicycle travel times from households to the hub. This disregards the suitability of the available infrastructure for cycling. Is is actually safe and comfortable to ride your bicycle? Therefore, a better way is to only consider the cycling network in the accessibility assessment, and disregard all other streets. But what is exactly “the cycling network”? Is this only separated bike lanes? Or is it everything where you are legally allowed to bike? Or something in between? What guarantees that your cycling network actually meets a certain quality standard? Instead of defining all this upfront and come up with a single aggregated accessibility metric, we opted to provide the policy makers with insights into how different definitions of cycling suitability lead to different results of the accessibility assessment. The final choice of what an acceptable suitability is, is then left to the policy maker, rather than to the data analyst.
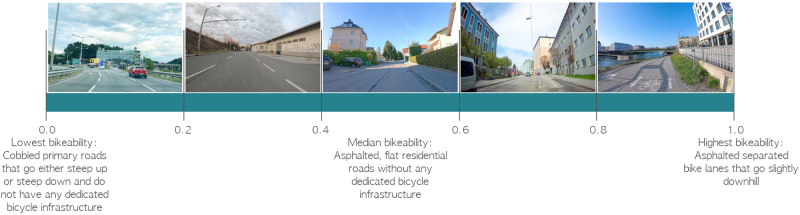
Our approach consisted of two simple steps. First, we computed a cycling suitability index for each street in a 15-minute network buffer around each hub. For this task we used the NetAScore toolbox which is developed within our research group. It computes a composite index by combining multiple weighted indicators that each describe a certain aspect of either bicycle safety or bicycle comfort. The index ranges from 0 (lowest suitability) to 1 (highest suitability). See also the figure below to get a better visual understanding of what the index means.
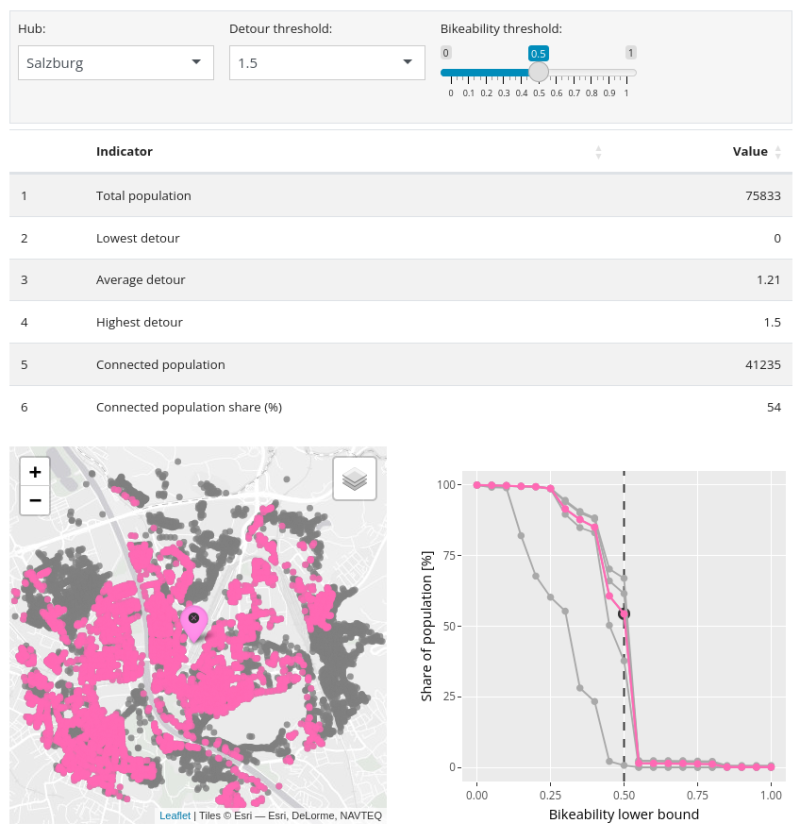
Secondly, we computed the share of households within the 15-minute buffer that can reach a bike parking facility at the hub location using only streets with a bicycle suitability score above a given index threshold, without making a detour from the shortest path that exceeds a given detour threshold. We repeated that computation for many different combinations of index thresholds and detour thresholds, allowing to compare bicycle accessibility levels based on different quality standards with each other. By the inclusion of the detour threshold, we also touched upon the directness principle of good cycling infrastructure, besides the safety and comfort principles that the NetAScore index already covers.
We provided the results in the form of an interactive notebook that allows you to change the threshold values and see how the results are impacted. You can find the notebook here. And the underlying code is of course available on GitHub.
We also presented the methodology behind this work in a more general form at the AGILE conference. This conference organized by the Association of Geographic Information Laboratories in Europe took place this year in the beautiful city of Glasgow, with the theme “Geographic Information Science for a Sustainable Future”. We had a great time there and made many new connections that hopefully will help to bring our work on bicycle accessibility to a next level. You can find the accompanying short paper in the conference proceedings: https://doi.org/10.5194/agile-giss-5-48-2024
Our approach is conceptually simple, which made it easy to explain and to communicate to policy makers. On the other hand, simplicity of course also has its drawbacks, since we are dealing with a complex system in which many factors are at play. In the discussion section of the paper, we discuss several of these issues along with directions for future research, and underline once again the inherent challenge of modelling: how to find a good balance between complexity and explainability?
Leave A Comment