Demo Applications
Bicycle Accessibility to Mobility Hubs
A successful multi-modal mobility hub should be well accessible by bicycle for the people it is meant to serve. This interactive notebook shows an analysis of the bicycle accessibility to various potential mobility hub locations in the province of Salzburg. It computes bicycle accessibility as the share of the population inside the catchment area of the hub that can reach the hub using only bikeable streets, without taking a unacceptable detour. It then shows how different definitions of what a bikeable street is, and different threshold for detour acceptance, influence the computed accessibility levels.
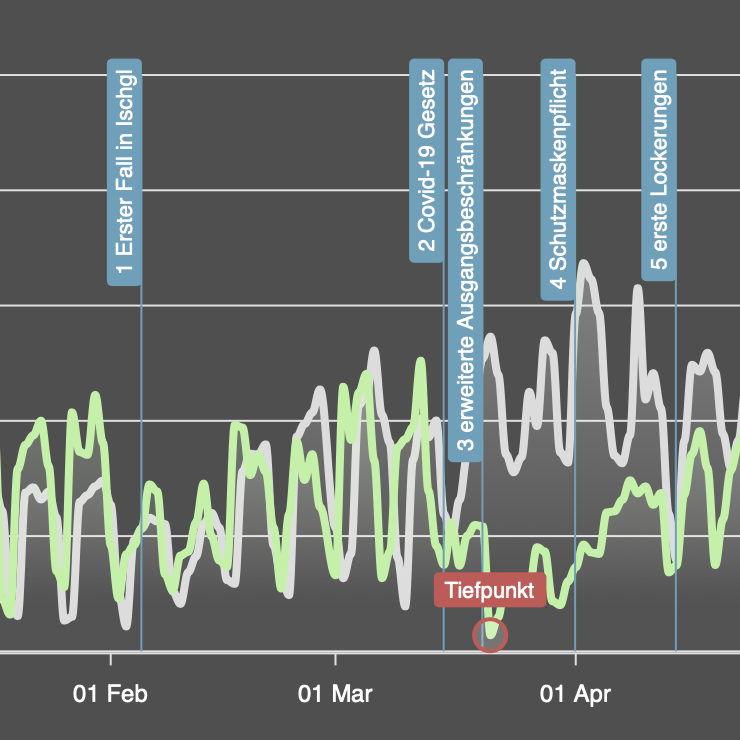
Bicycle Traffic in the City of Salzburg
Follow the developments in cycling in Salzburg during the Covid19 pandemic. The dashboard shows the volume of bicycle traffic compared to the previous year, as well as the change in total mobility in the state of Salzburg and in Austria. The data is updated daily and obtained directly from the bicycle traffic counting station on Rudolfskai and from the Google Mobility Report. It is particularly interesting how the requirements and measures of the federal government regarding Covid19 affect bicycle traffic. During the lockdown phase, there was a massive incursion of bicycle traffic in Salzburg.
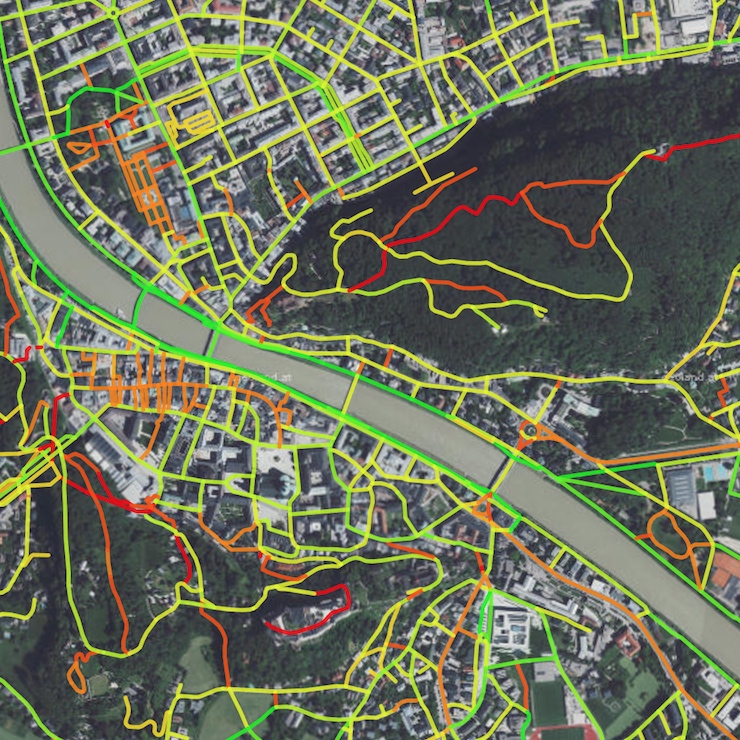
Assessment Network
The evaluation of the equipment in the street space allows uniform comparability based on official data. All road-related information is stored in the graph integration platform (GIP). From this, indicators can be derived which influence the suitability for cycling (bikeability). The indicators are displayed in the map window. The influence (weighting) on the evaluation can be regulated using a slider. The result is an index value that expresses the bikeability in percent. Each street segment can be controlled with a click of the mouse. You can then see which properties are stored for the respective segment and lead to the calculated index value.
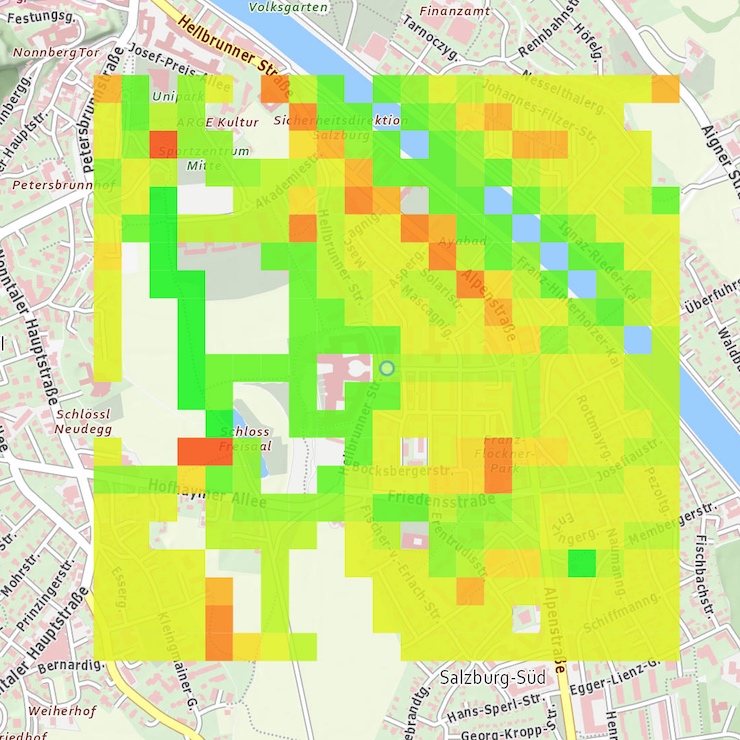
Assessment Bikeability
The design of the street space in the immediate vicinity of the apartment, the workplace or frequently frequented facilities has a proven effect on the choice of means of transport. Pedestrian and bicycle-friendly equipment therefore contributes to a higher proportion of sustainable mobility. Click on any point on the map to calculate the bikeability in the catchment area of the selected location. The average suitability is shown in percent for each grid cell. The average value below expresses the bikeability in the entire catchment area considered. With another click you can delete the entry.
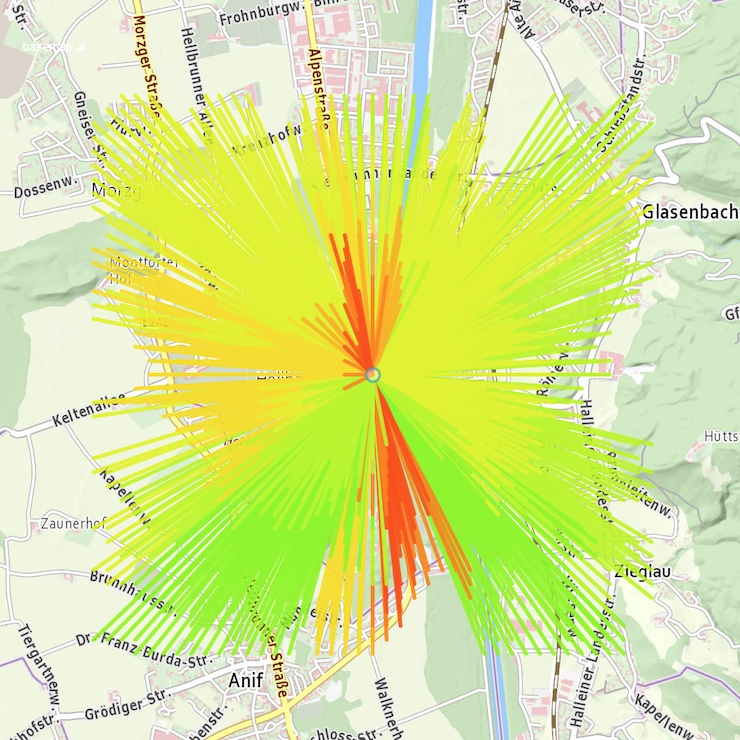
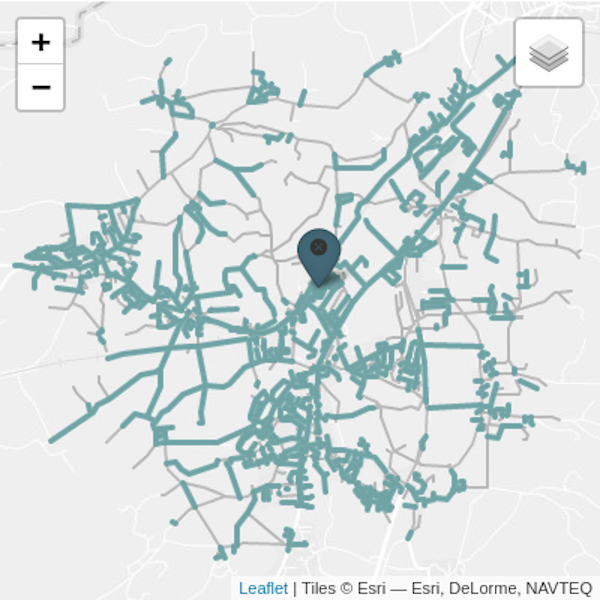
Assessment Accessibility
The accessibility of facilities is a significant location advantage. Not only the immediate surroundings, but the entire route from the point of departure to the destination is crucial for accessibility. Clicking anywhere on the map calculates 1.680 routes from the 4 × 4 km catchment area. The schematic lines express the average index value of the bikeability from the starting point to the target point. For the route calculation, a model is used that weights safety and comfort higher than the shortest distance. The ray diagram shown on the map gives an impression of the directions from which a location with which quality can be reached. With another click on the card you delete your input.